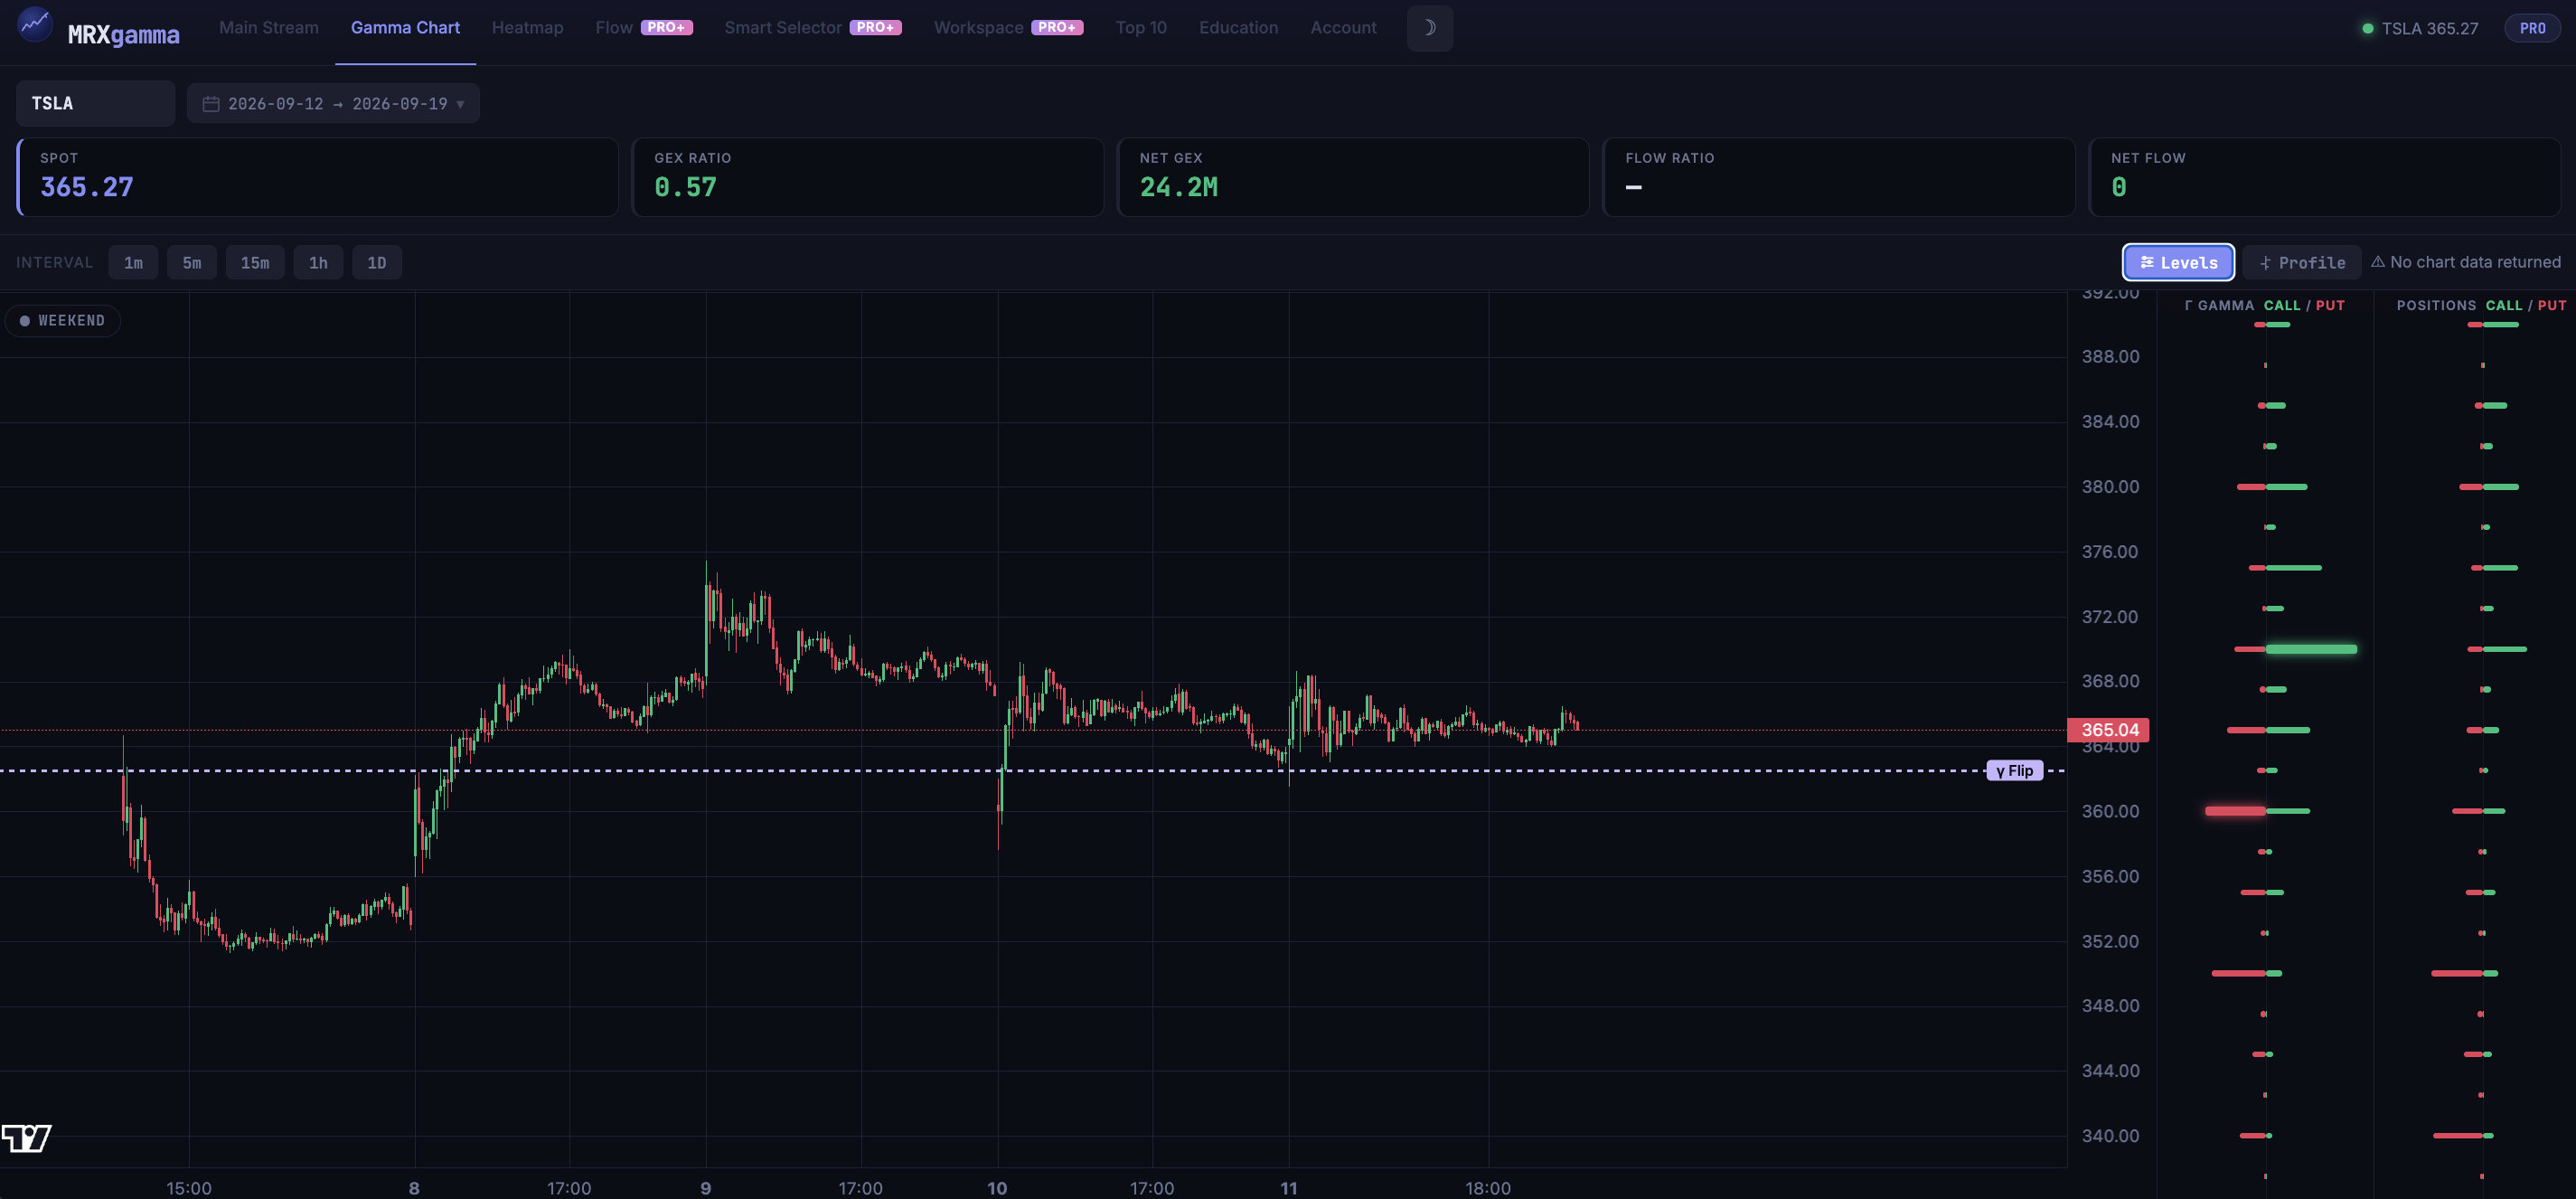
The Gamma Flip (Zero Gamma)
The gamma flip — also called zero gamma — is the price where dealers' net gamma exposure changes sign. It's the single most important line on the chart because it tells you what kind of day to expect.
Above the flip: dealers are usually long gamma. Their hedging leans against price, so moves get dampened — think chop, mean-reversion and pinning.
Below the flip: dealers are usually short gamma. Their hedging chases price, so moves get amplified — think trending, momentum and higher volatility.
- Spot above γ-flip → expect range / mean-reversion
- Spot below γ-flip → expect trend / volatility expansion
- A break through the flip often changes the character of the whole session
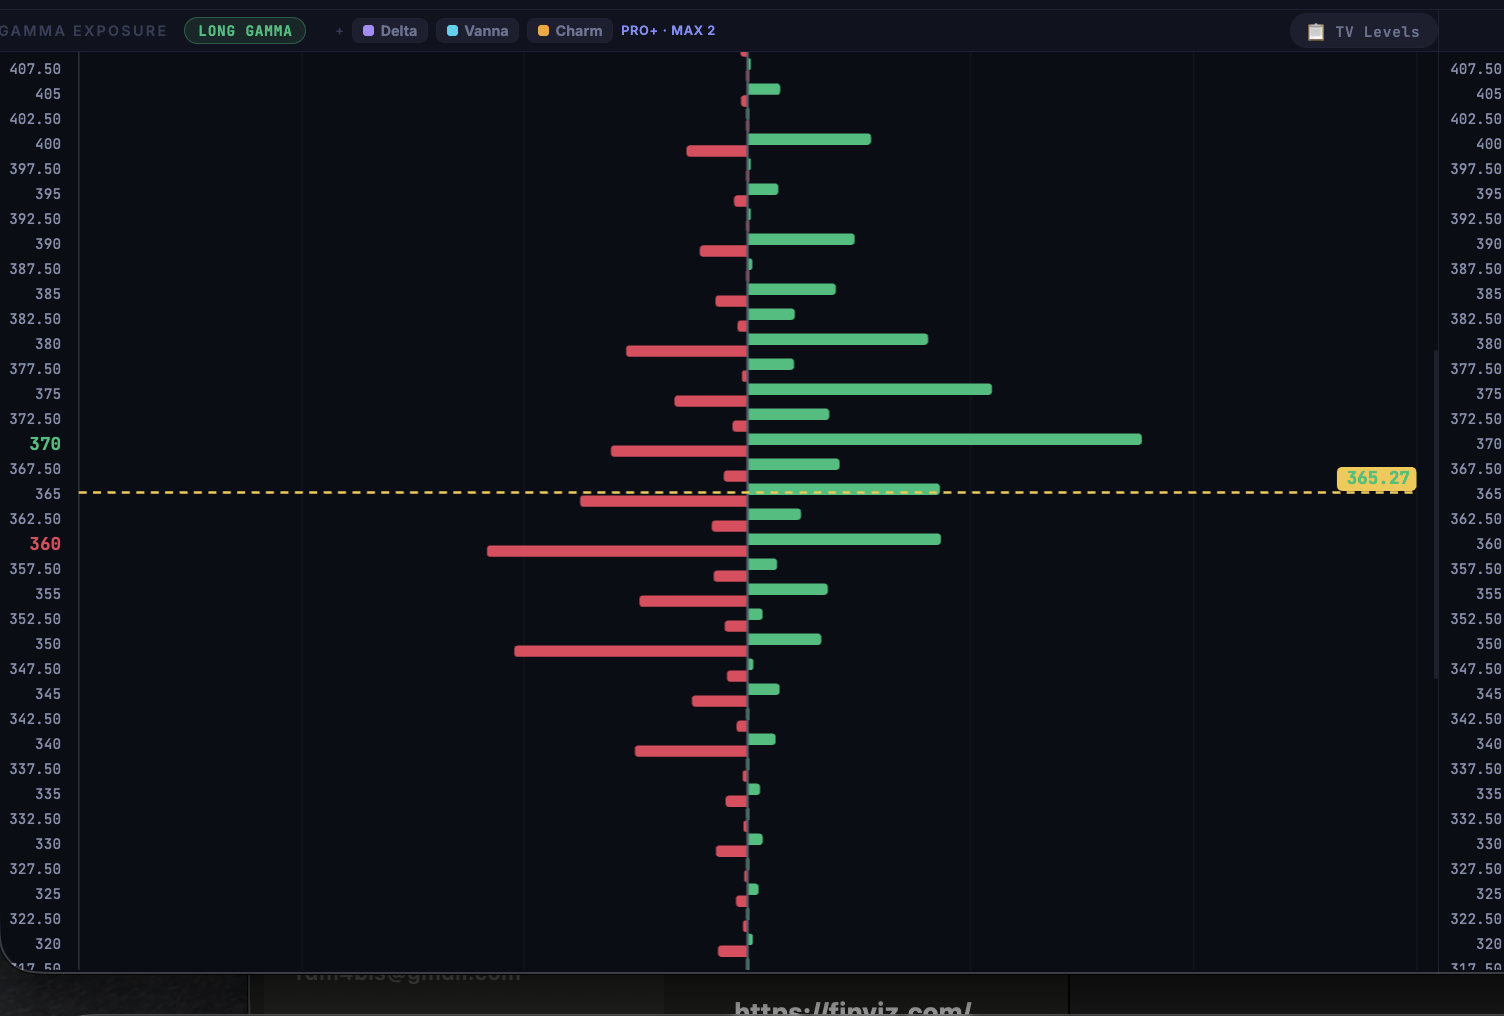
Positive vs Negative Gamma (Gamma + / −)
Net GEX has a sign, and that sign is the market's volatility regime.
Positive / long gamma (+) means dealers dampen moves. Rallies get sold, dips get bought — price tends to revert toward high-gamma strikes. Great for range and fade setups.
Negative / short gamma (−) means dealers amplify moves. Rallies force more buying, dips force more selling — price tends to trend and accelerate. Great for momentum, dangerous for fading.
- Green bars = positive gamma at that strike (stabilizing)
- Red bars = negative gamma at that strike (destabilizing)
- Net GEX sign sets your whole game plan for the session
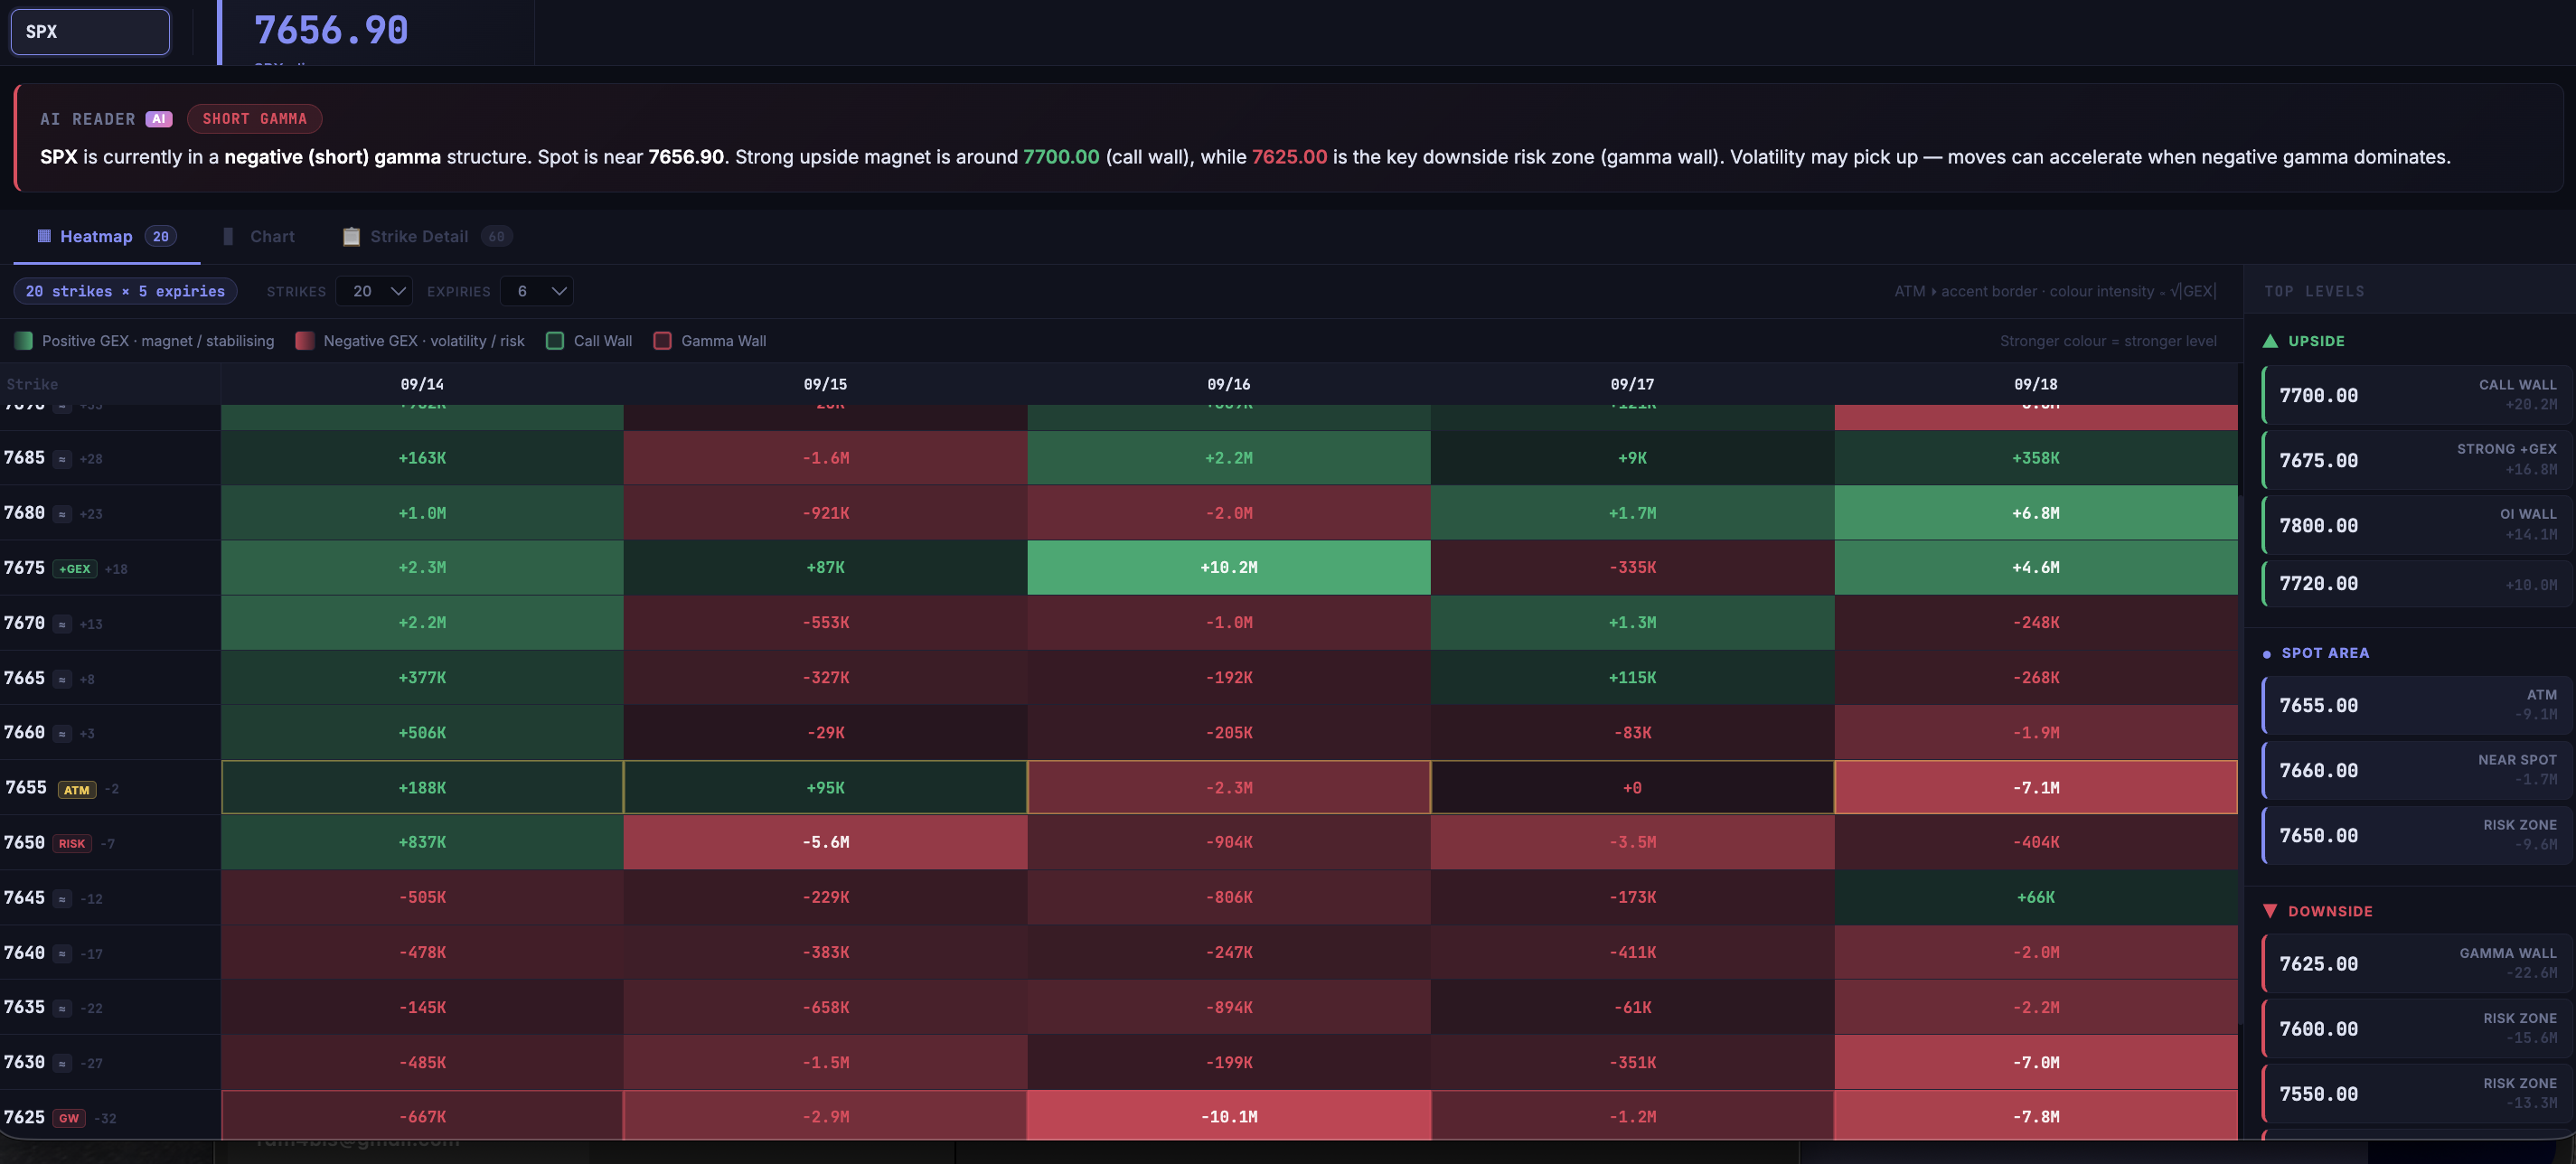
The Gamma Heatmap
The heatmap maps gamma exposure across every strike and expiration at once. Instead of reading one chart, you see the entire options surface as a grid of color.
Bright green cells are heavy positive-gamma zones — the walls that act as magnets and resistance. Bright red cells are heavy negative-gamma zones — where moves can accelerate. Tags like CW (call wall), +GEX and ATM mark the levels that matter most.
- Find gamma concentration clusters instantly
- See how walls build or decay across expirations
- Spot the magnets price is likely to gravitate toward
Options Inventory (OI)
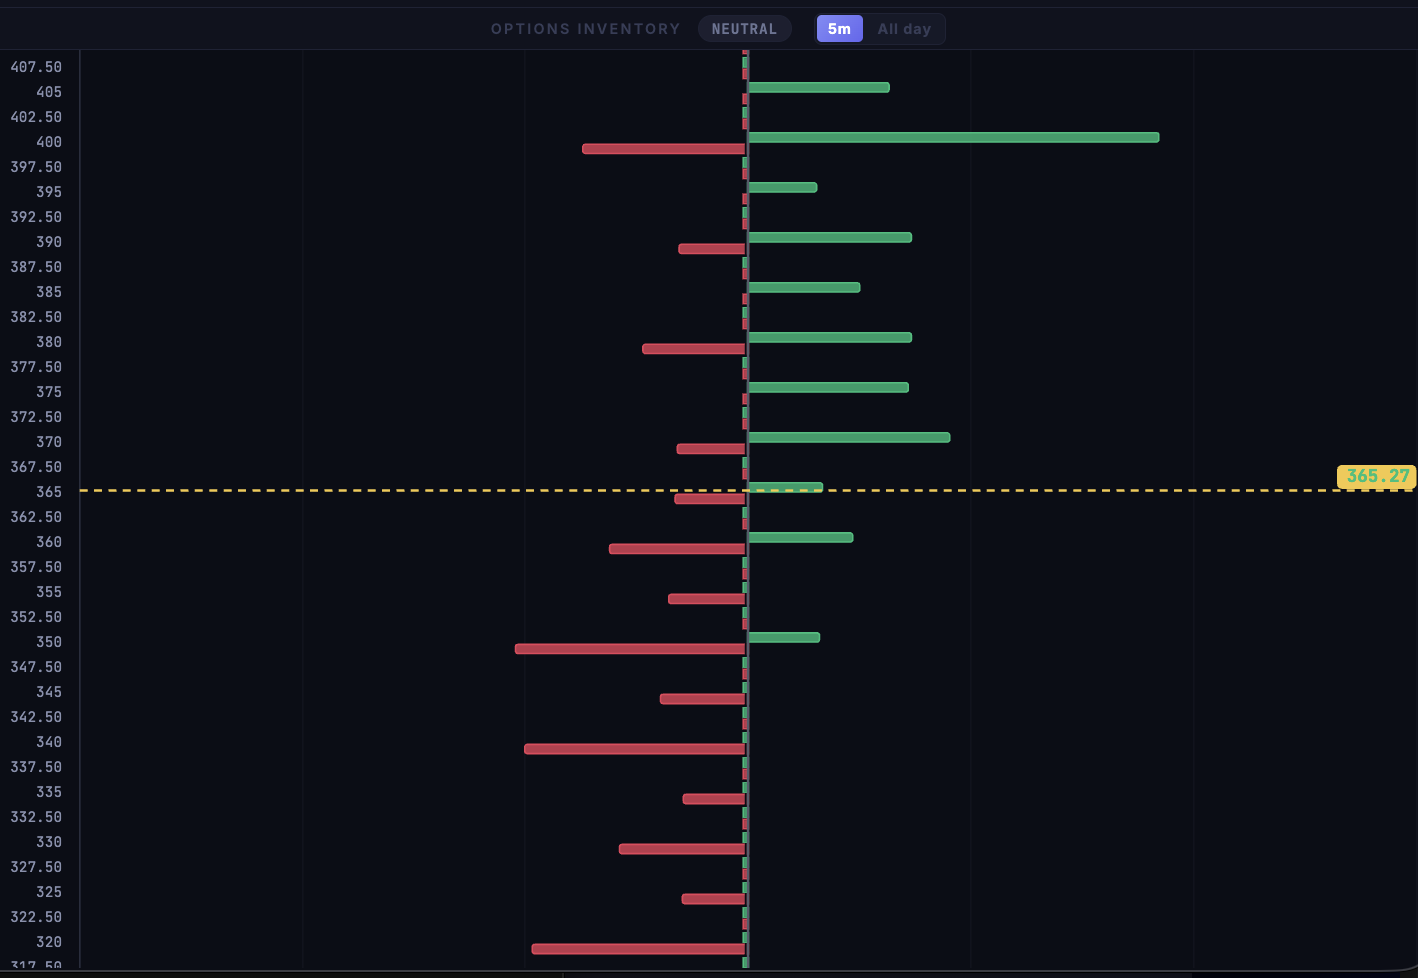
Options inventory shows the open interest sitting at each strike — the actual positions dealers must hedge. Where inventory is stacked, hedging pressure is strongest.
Reading inventory next to gamma tells you why a level matters: a big call wall with heavy inventory is a stronger magnet than gamma alone suggests. Toggle 5-minute vs all-day to see fresh positioning versus the standing book.
- Call vs put inventory at every strike
- 5-minute view = today's fresh positioning
- All-day view = the standing book dealers must hedge
Using Delta or Gamma (and Vanna & Charm)
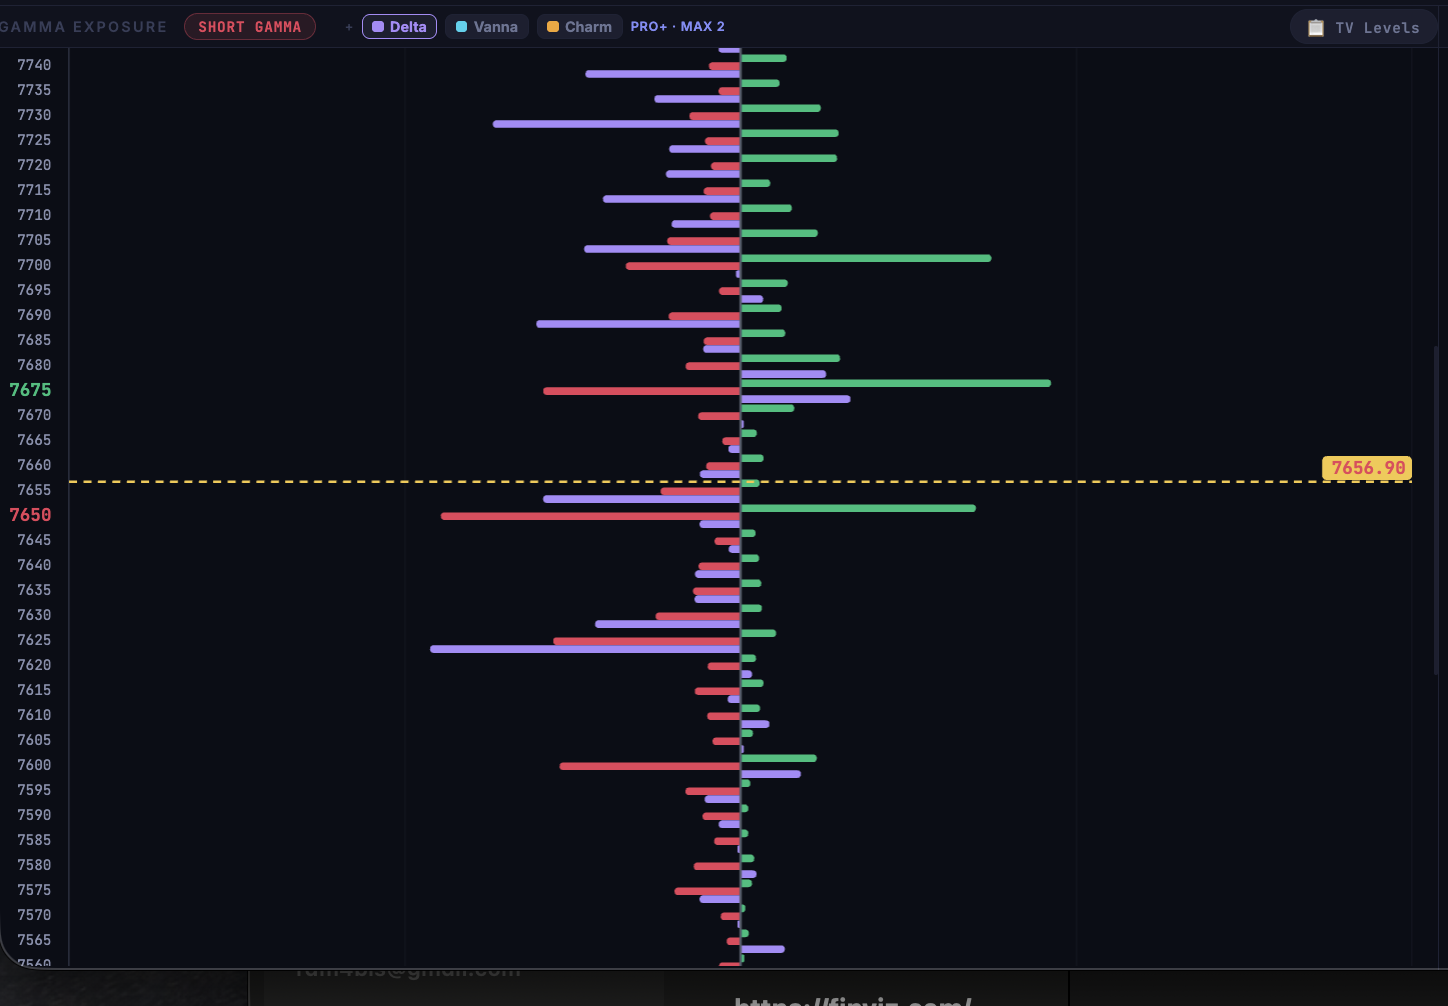
MRXgamma lets you view exposure through different greeks, each answering a different question:
Gamma — how aggressively dealers must hedge as price moves. This is the pin/acceleration lens.
Delta — the directional exposure dealers carry, useful for gauging directional pressure.
Vanna & Charm — how hedging shifts as volatility and time change; the slow currents that drive drift into expiration and around events.
- Gamma → pinning & acceleration around strikes
- Delta → net directional pressure
- Vanna/Charm → vol- and time-driven drift (great for 0DTE)
Options Flow (Live Tape)
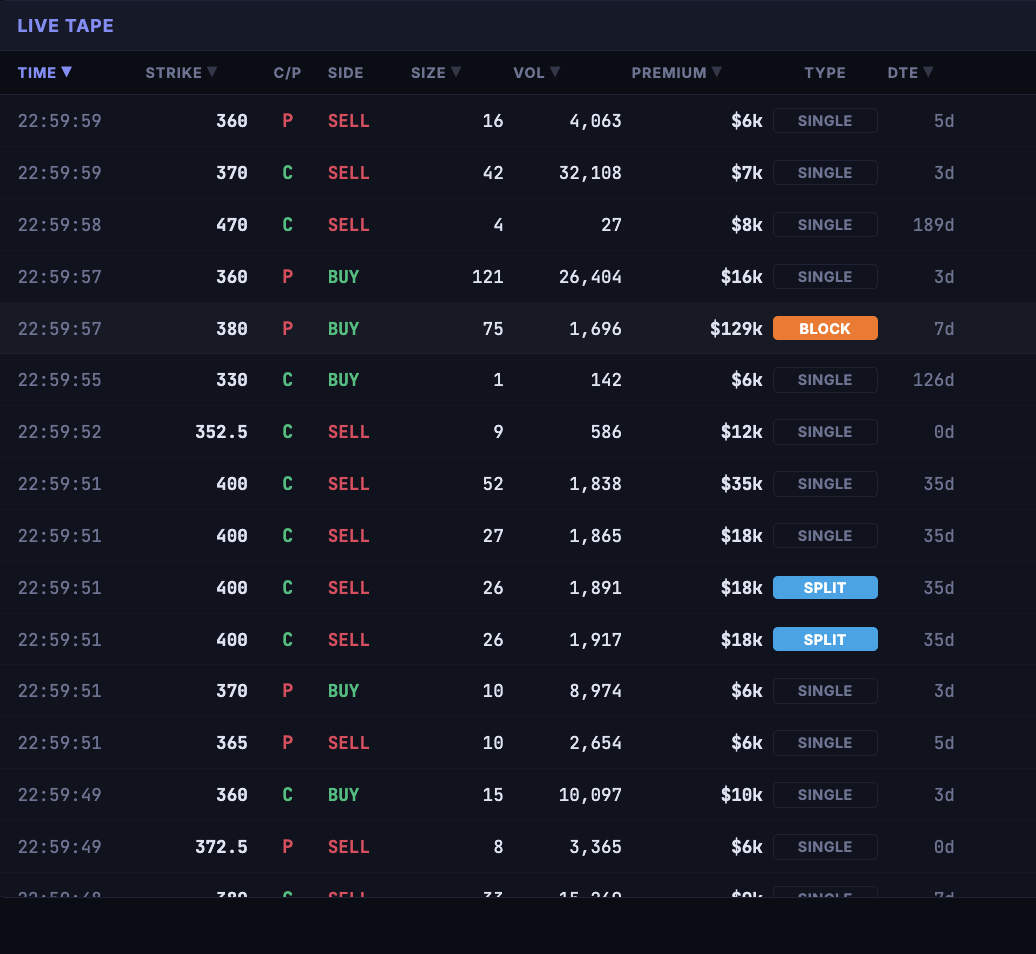
Options flow is the live tape of executed options trades. Every print shows the strike, call/put, side, size, premium, and whether it was a single, a split, or a large block.
Flow reveals where real capital is positioning right now — big premium hitting the ask, repeated sweeps in one strike, or a block trade can front-run a move that gamma alone won't show. Combined with GEX, flow tells you both the terrain and the traffic.
- Live prints: size, premium, side, DTE
- Block & sweep tags highlight institutional size
- Flow bias confirms or fades the gamma picture